

Customer Service Statistics from 2022 to know for a better 2023

Last year we had an incredible journey, and we wanted to share some customer service statistics with you. These are all the customer service statistics you need to know to deliver excellent customer service in 2023.
Considering that 48% of consumers have stopped doing business with a company after a poor experience, it’s clear that customer service quality is a driver for success.
These are your statistics on customer service, conversations, replies, and contributions to making our mission closer daily.
As we prepare for another incredible year of creating the most compelling customer service experience for you and your customers, we wanted to take a moment to reflect on all the ways you have improved your customer support and automated your communications over the last 12 months.
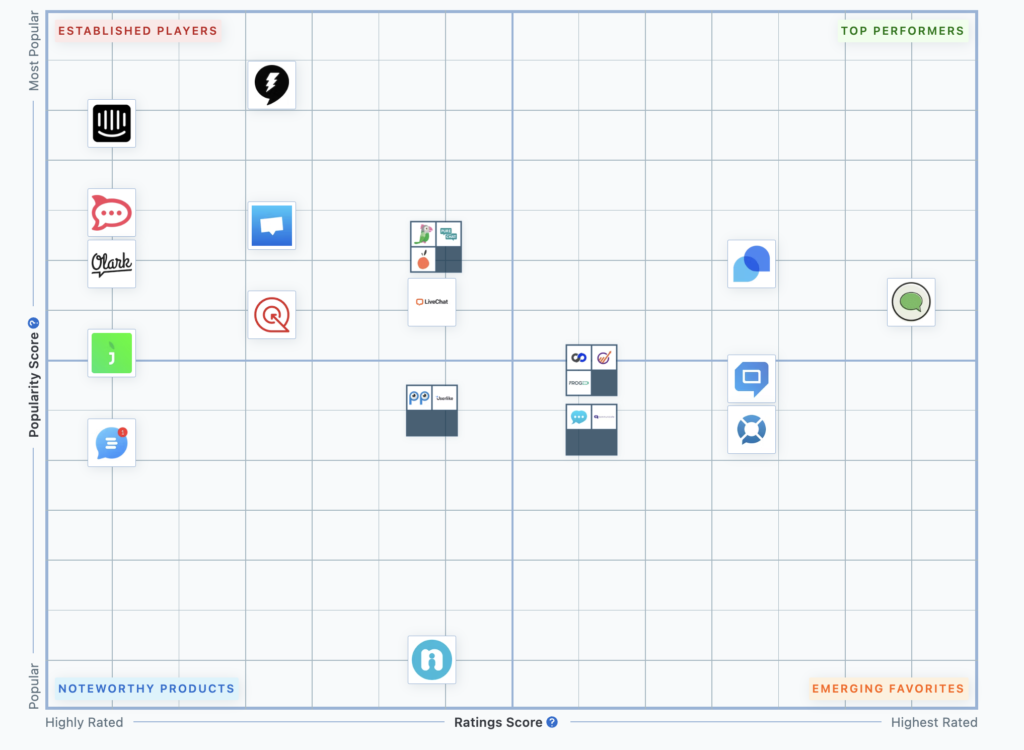
Thanks to you, Customerly has been shortlisted as one of the top live chat software in the World as Noteworthy Product for the second year in a row.
And we are very grateful for your support.
Let’s now dive into the customer service statistics and see how 29,000 businesses handled customer service but first, a couple of statistics of Customerly user base.
Business Statistics
29,182 are the businesses using Customerly worldwide to deliver excellent customer service, gather customer feedback and allow their customer service teams to better understand and help their customers.
+7,718 are the unique Customerly projects created by you in the last 12 months.
Statistics on Customer Service Market
The global live chat software market was valued at $755.23 million in 2020 and is projected to reach $1.7 billion by 2030, growing at a CAGR of 8.8% from 2021 to 2030. [source]
The help center software market was valued at $9.9 Billion in 2021, growing at a CAGR of 9.4%, projecting the total value in 2032 at $26 Billion. [source]
The Customer Service Software Market in 2021 was valued at $10.5 Billion and is projected to reach $58.1 billion in 2030. [source]
Meaning more and more companies are investing in live chat solutions to deliver excellent customer service.
+9,054 are the customer service reps or teammates you added to existing or newly created projects. On average 1.17 accounts per project.
But let’s talk about how you improved your customers support with the help of Customerly Service Solutions.
Customer Service Statistics
To gather these customer service statistics, we have analyzed our database of 29,182 customers, and these are the results.
4,060,166 are the new unique conversations opened by your customers through the live chat or forwarded via email to the inboxes.
The average cost per conversation handled varies by industry and country. On average, a conversation handled costs $7.
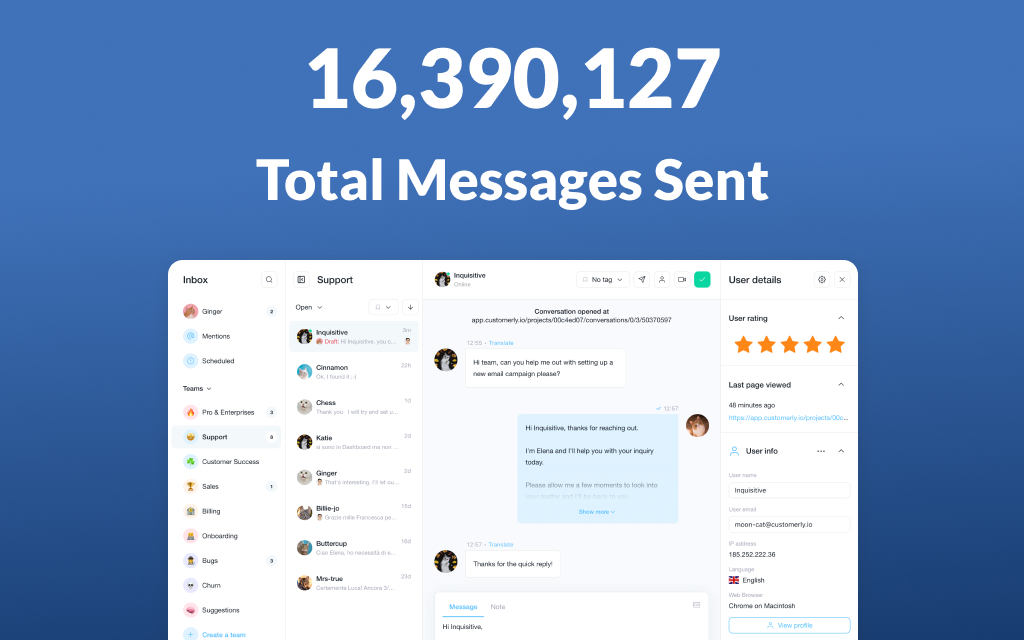
16,390,127 are the total messages your customers sent you via chat or email.
On average of 4 messages are sent for every new conversation.
Canned Responses Statistics
3,193 canned responses were created by you last year. Great job.
Those canned responses have been used 324,160 times. An average of 101 times each canned response was created.
The average length for a canned response is 637 characters, meaning 206,489,920 characters were not written manually anymore.
17,207 hours saved from customer service teams per year, considering the 200 characters per minute typing speed.
That is an astonishing 716 days in a year saved for our customers.
The more canned responses you use, the quicker you reply and the happier your customers will be. Great customer service is always fast and responsive. Learn how to improve your customer service skills.
95% of consumers say customer service is key to their brand loyalty [Microsoft source]. This is why offering a live chat available on each page of your website makes a difference in customer retention.
Live Chat Statistics
Of all the Customer Service Statistics, we wanted to focus on the Live Chat statistics and see how many live chats we have shown on our 29,182 customer websites or mobile apps.
The following customer service statistics are incredible. And there is a B in one of those.
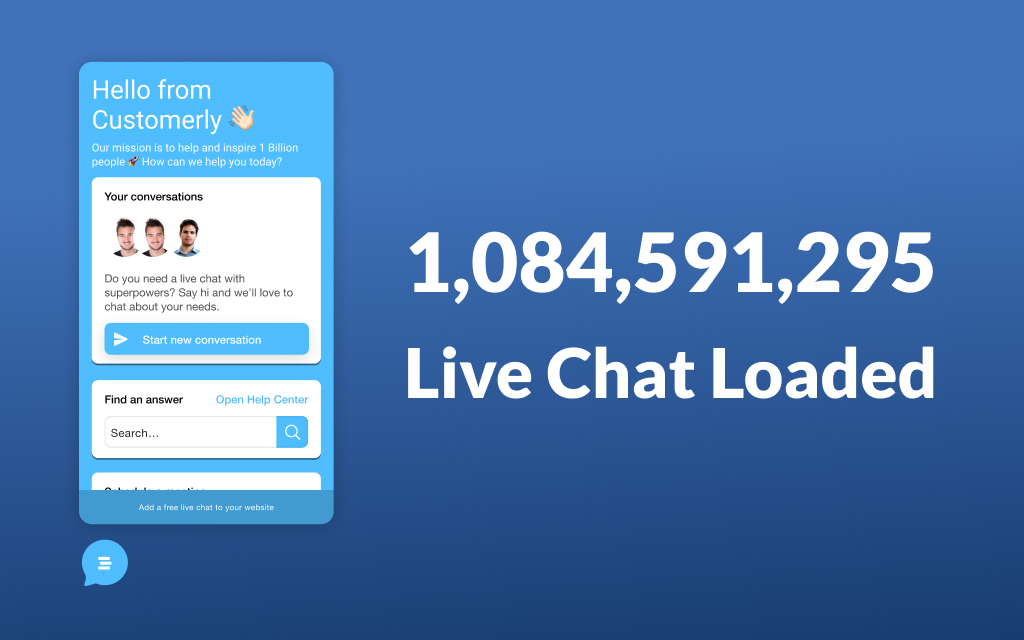
1,084,591,295 is the number of times the Customerly live chat was shown on your websites.
26,965,809 total events tracked from the live chat helped our customers understand and better target user behavior to send the right messages at the right time.
11,252 Chat triggers created by your marketing teams to better engage with their customers on landing pages and apps. Customer Success teams now use chat triggers also to improve customer satisfaction.
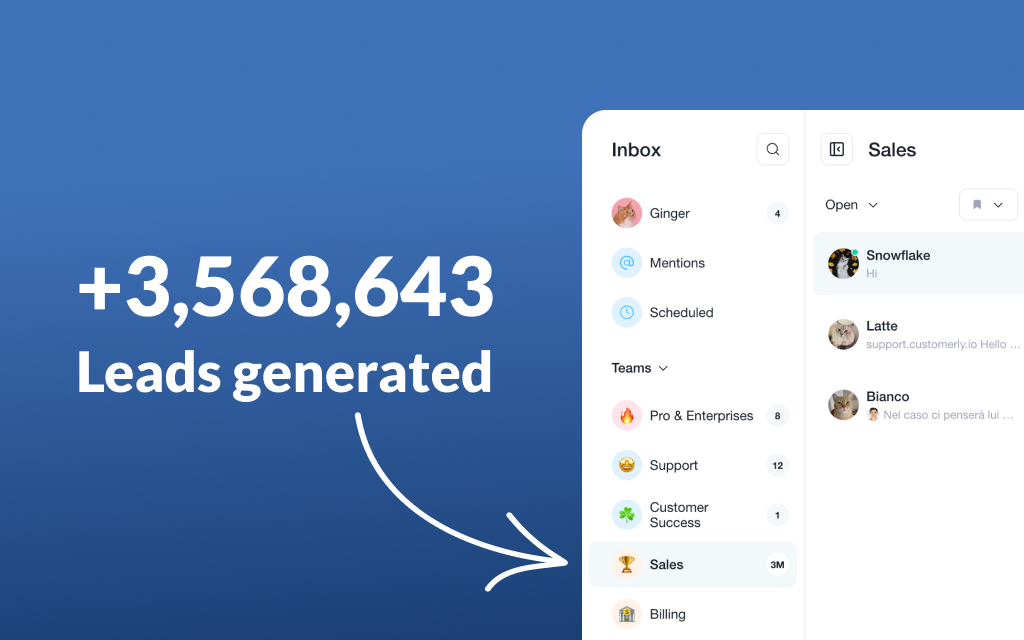
**3,568,643** New Leads you generated thanks to the live chat installed on websites.
72% of new leads were generated by Chat triggers like the following.
This is by far one of the most important customer service statistics ever, in fact, 222 new leads were generated per chat trigger campaign on average.
Customer Service Agents Statistics
Another customer service statistic is regarding the average time to close or AHT.
This depends a lot on your business hours and customer service team size, but we can see in our most responsive and effective customers that an average time to close is 15h.
How many conversations do customer service agents resolve per day?
On average, some of the most performing customer service agents close from 600 to 1150 customer service conversations daily.
The first reply average time goes from 49 minutes up to 24h.
Help Center Statistics
High-quality customer service also depends on the time to resolve an issue. This is where help center software come to help. Here are some customer service statistics of our customers using a knowledge base to automate some repetitive questions.
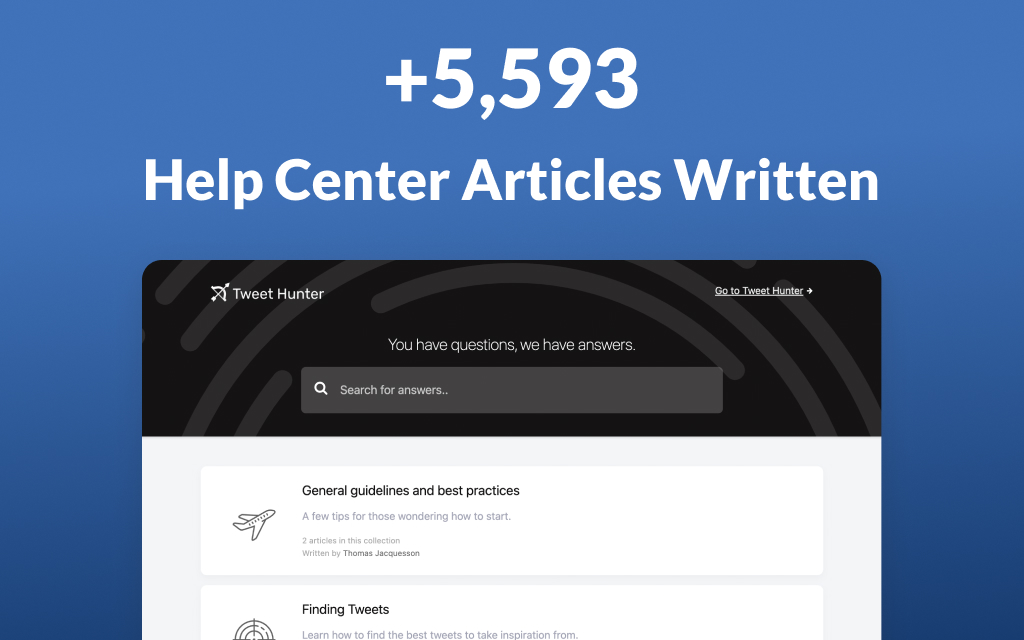
+5,593 new knowledge base articles have been created from you on your help center.
+1,687,884 are the total support tickets you managed to avoid, thanks to customer support automation and knowledge base articles.
The total amount of money saved thanks to customer service tickets avoided is an astonishing $11,815,188.
The number of reactions people left is 8,414, of which 58% found useful the article they were reading.
I bet you now want to invest time to build a solid knowledge base for your company as well.
Customer Success Statistics
Delivering great customer service requires you to track your customer satisfaction. We have collected for you all the metrics you should know about it.
Net Promoter Score Survey Statistics
55,846 Net Promoter Score Survey votes you have collected from your customers.
The average NPS vote collected is 8, and 44% left additional feedback on average.
These are the number of votes and the related number of feedback released.
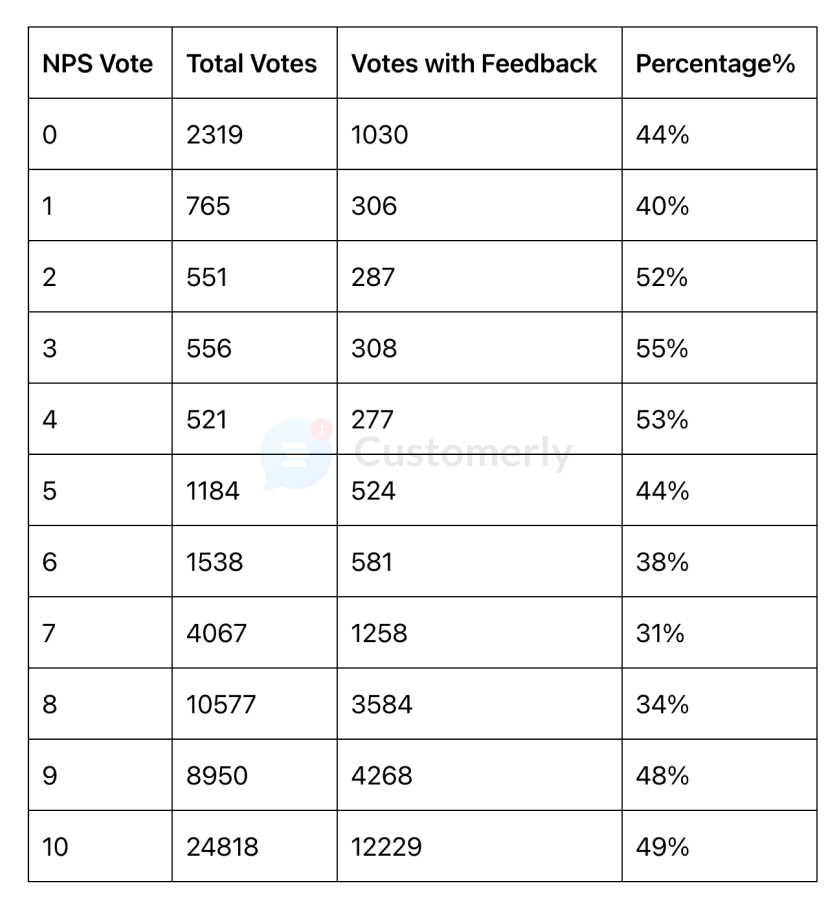
It’s curious to see how the detractors are more willing to add additional feedback after the vote rather than the promoters. At the same time, the Passives (7/8) are indeed passive, with the lowest interest in sharing additional feedback.
In-App Survey Statistics
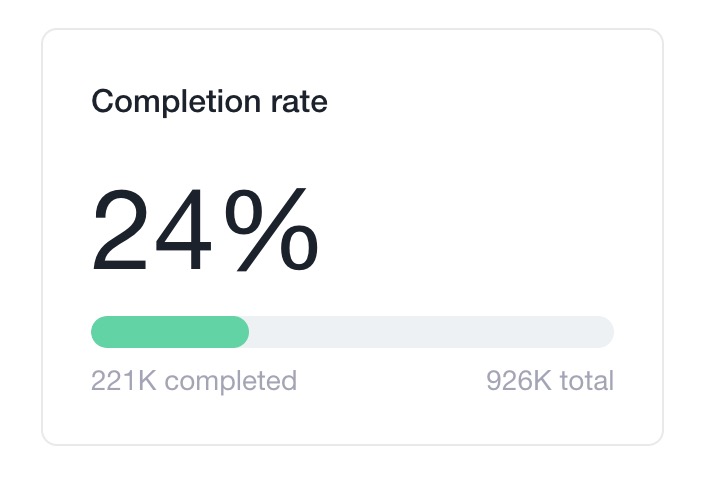
86,667 In-app Surveys have been delivered to 926,249 SaaS users, which 221,939 were completed.
The average completion rate for an in-app survey is 24%.
While the completion rate involves different factors, such as the length of the questions and the relevancy of the questions for the chosen audience, a good survey response rate is between 5% and 30%.
In-app surveys show an answer rate of 34%, better than any other kind of online survey.
Check out our survey templates to start gathering customer feedback. One of the most used templates is the source of acquisition.
Marketing Automation Statistics
1,270 total workflows you have created to automate marketing messages to your customers.
10,285 awesome email campaigns you designed with the new email template builder and sent.
101,001,476 total emails sent from all of you as newsletters or automated marketing campaigns.
17,640,930 emails were opened by all your customers. If you were wondering what’s the average open rate 17% is your number. If you are higher than this, you are doing a great job! If you are not, check out this article on how to improve your email open rate.
729,212 are the number of clicks your customers made from those email campaigns.
The average CTR for an email marketing campaign is 4% given our customer’s data.
Product Statistics
Building and maintaining Customerly is challenging, and in the last year, the team managed to make the impossible.
3,828 commits were added for you on our repositories.
In the past year, we have released the following:
- New Inboxes with
- Scheduled messages
- Team mentions
- Shortcuts
- Canned Responses Shortcuts
- Customizable Contact sidebar
- New Help Center manager
- A Brand new Outbound section with
- Chat triggers
- Question Profiling
- New Email Template Builder and Manager
- New Workflows
- Workflows execution time increased by 198.671%, now executing steps and sending in less than 2 seconds.
- Email sending has been improved by 10X.
- The List management and filtering have been significantly improved
This year we are going to shape the customer service market once again by releasing plenty of useful tools such as:
- Chatflows to better control your conversations with your customers and automate even more your customer service.
- Help Center improved with new technology and support for multilanguage. This improvement will also reflect in better SEO.
- Mobile Apps to support newly added features and offer a better experience.
Conclusions
Those Customer Service Statistics based on a wide range of data help you understand customer service is important to gather more loyal customers and create the lasting customer experience your customers are searching for.
Start today to increase your customer satisfaction scores and create a positive customer experience by adopting Customerly.
Signup for a 14-day free trial and be part of those companies that deliver great customer service.
Automate Smarter with
Customerly Aura
Related articles
Get the latest strategies, tips, and trends in customer service Learn how to deliver exceptional customer service and boost customer loyalty.