

All the SaaS Terms you will ever need

Sometimes getting acquainted with all the jargon in the tech industry can be challenging. Especially if you work in the SaaS industry, you will get to know plenty of SaaS terms.
This article will help you navigate every new SaaS terminology you encounter in your SaaS journey.
Explore also our new Glossary for all the terms related to Customer Support, Marketing automation, and customer satisfaction.
But first of all, let’s start with the SaaS definition.
What does SaaS mean?
The definition of SaaS is simple and stands for “Software as a Service.” It refers to a software delivery model in which a software application is hosted by a third-party provider and made available to customers over the internet.
In a SaaS model, the provider is responsible for hosting the software, maintaining and updating it, and providing user support.
Customers pay a subscription fee to access and use the software rather than purchasing it outright and installing it on their servers or computers.
SaaS is a popular delivery model for many types of software, including business applications, productivity tools, and collaboration platforms.
It offers several benefits, such as lower upfront costs, easy access to the latest software versions, and the ability to scale up or down as needed.
You can also find a list of the Best SaaS Tools to get a sense of what kind of SaaS solutions are available to you.
Revenue SAAS Terms
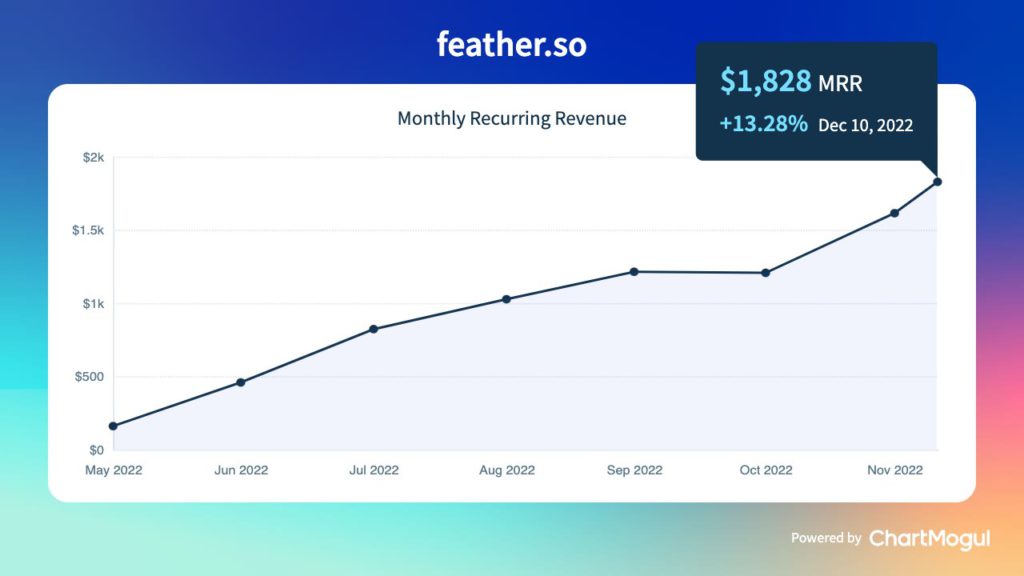
MRR – Monthly Recurring Revenue
It measures the predictable, recurring monthly subscription revenue that a business generates from its subscription-based products or services every month.
MRR is calculated by multiplying the number of active subscribers by the average revenue per subscriber. For example, if a business has 100 subscribers paying $100 per month, its MRR would be $10,000 ($100 x 100).
MRR is an important metric for businesses that rely on recurring revenue streams, as it helps them understand the stability and growth of their revenue over time.
It is often used to track subscription-based businesses’ performance and make informed decisions about marketing, sales, and product development efforts.
ARR – Annual Recurring Revenue
It measures the predictable, recurring revenue a business generates annually from its subscription-based products or services.
ARR is calculated by multiplying the monthly recurring revenue (MRR) by 12. For example, if a business has an MRR of $10,000, its Annual Recurring Revenue would be $120,000 ($10,000 x 12).
ARPA – Average Revenue Per Account
It is a measure of the average revenue that a business generates from each of its customer accounts.
ARPA is calculated by dividing the total revenue generated from all customer accounts by the number of customer accounts. For example, if a business generates $100,000 in revenue from 100 customer accounts, its ARPA would be $1,000 ($100,000 / 100).
ARPA is an important metric for businesses that rely on multiple customer accounts to generate revenue, as it helps them understand the average revenue generated from each account.
ARPU – Average Revenue Per User
It measures the average revenue SaaS businesses generate from their users or customers.
ARPU is calculated by dividing the total revenue generated from all users by the number of users.
For example, if a business generates $100,000 in revenue from 10,000 users, its ARPU would be $10 ($100,000 / 10,000).
Gross Churn Rate
The Gross churn rate measures the percentage of customers that cancel or fail to renew their subscriptions with a business over a given period.
It is calculated by dividing the number of lost customers by the total number of customers at the beginning of the period.
For example, if a business starts the year with 1,000 customers and loses 100 customers over the course of the year, its gross churn rate would be 10% (100 / 1,000).
Gross churn rate is an important metric for businesses that rely on recurring revenue streams, as it helps them understand the stability and growth of their customer base over time.
A high gross churn rate can indicate that a business is losing customers at an unsustainable rate and may need to improve its products or customer retention efforts.
On the other hand, a low gross churn rate may suggest that the business is effectively retaining its customers and may be well positioned for growth.
Deferred Value
Deferred value refers to the value of a product or service that has been received by a customer but has not yet been fully paid for.
Deferred value is commonly used in the context of subscription-based businesses, where customers pay for a product or service over some time rather than upfront.
Deferred value is typically recognized as revenue on a company’s income statement over the period that the product or service is being provided to the customer.
For example, if a customer subscribes to a service for $100 per month for only a few companies per year, the deferred value of the contract would be $1,200 ($100 x 12). The company would recognize this revenue on its income statement over the course of the year as the service is provided to the customer.
Deferred value is an important metric for businesses that rely on recurring revenue streams, as it helps them understand the value of their contracts and the potential revenue they can generate over time.
MCR – Monthly Churn Rate
It is a metric that reflects the percentage of customers that a business loses in a given month.
MCR is typically calculated by dividing the number of customers lost in a month by the total number of customers at the beginning of the month and expressing the result as a percentage.
The Monthly Customer Churn Rate is an important metric for businesses because it can help them understand the effectiveness of their customer retention efforts and identify improvement areas.
A high MCR may indicate that a business is losing customers faster than it is gaining new ones, which can signify problems with the product, service, or customer experience.
Conversely, a low Monthly Churn Rate may indicate that a business is successfully retaining its customers and may perform well in the market.
Retention
In customer retention, a business strives to keep its customers satisfied and loyal to the company so that they continue to use its products or services and do not switch to a competitor.
This can involve providing excellent customer service, regarding customer behavior index offering competitive pricing, or developing innovative products or services.
Net Churn
Net churn is a metric that reflects the net change in the number of customers over a given period.
It is calculated by subtracting the number of new customers gained from the number of customers lost during the same period.
Net churn can be positive or negative.
A positive net churn means that a company has gained more new customers than it has lost, which is generally seen as a good thing.
A negative net churn means that a company has lost more customers than it has gained, which can signify problems with the product or service or customer experience.
Net churn is an important metric for businesses because it can help them understand the effectiveness of their customer retention efforts and identify improvement areas.
By tracking net churn over time, businesses can monitor their performance in the market and adjust their strategies as needed.
MRR Projection
MRR projection forecasts a business’s expected monthly recurring revenue (MRR) over a specific period.
Monthly Recurring Revenue is a metric that reflects the amount of contracted monthly recurring revenue, predictable revenue a business generates from its customers.
It is often used to track the performance of subscription-based businesses, providing a more predictable view of revenue than one-time sales.
MRR projection is an important tool for businesses because it helps them to understand the expected growth or decline of their revenue over time and to plan for future expenses and investments.
By projecting MRR, businesses can set realistic goals for their sales and revenue and identify areas for improvement or potential challenges.
To create an MRR projection, businesses typically start with their current Monthly Recurring Revenue and make assumptions about future customer acquisition, customer retention cost, and churn.
They may also consider external factors such as market trends and competitive dynamics.
MRR projections are typically based on a combination of historical data and future assumptions and are intended to provide a rough estimate of future performance rather than a precise prediction.
🧰 Suggested tools to measure Financial metrics like MRR, ARR, Customer Churn Rate, ARPU, and MRR Projection are Chartmogul, ProfitWell, FounderPath.
Marketing SaaS terms
CAC – Customer Acquisition Cost
It measures the cost associated with acquiring a new or existing customer, for a business.
The CAC is calculated by dividing the total cost of sales and marketing efforts (All the customer acquisition costs) specifically aimed at acquiring new customers by the number of new customers acquired during a specific period.
For example, if a business spends $100,000 on marketing expenses and sales efforts to acquire new customers in a year and acquires 1,000 new customers during that time, the total customer acquisition costs would be $100 per customer.
The Customer Acquisition Cost is an important metric for businesses because it helps them understand the cost of acquiring new customers and determine whether their sales and marketing efforts produce a good return on investment.
A high CAC can indicate that a business is spending too much to acquire new customers, while a low CAC may suggest that the business is effectively targeting and converting potential customers.
Engagement Loop
The engagement loop in SaaS (software as a service) refers to continuously engaging and interacting with customers to increase their usage and satisfaction with the product.
The goal of the engagement loop is to keep customers actively using the product so that they are more likely to become loyal, long-term customers and generate recurring revenue for the business.
The engagement loop typically involves several steps, including:
- Onboarding: This is introducing new customers to the product and helping them understand how to use it effectively. Onboarding may involve training, support, and emails to help customers get started with the product.
- Usage tracking: This involves monitoring and tracking how customers are using the product in order to understand their needs and preferences. This can be done through analytics tools or through customer feedback.
- Communication: This involves regularly communicating with customers to provide updates, support, and other resources to help them use the product more effectively. This can be done through email, social media, or in-app messaging.
- Upselling: This involves offering additional products or services to existing customers to increase their usage of the product and their value to the business.
Following the engagement loop, SaaS businesses can increase customer retention and loyalty and generate recurring revenue.
CTR – Click-through Rate
It is a metric used to measure the effectiveness of an online advertising campaign for a particular website and an email campaign.
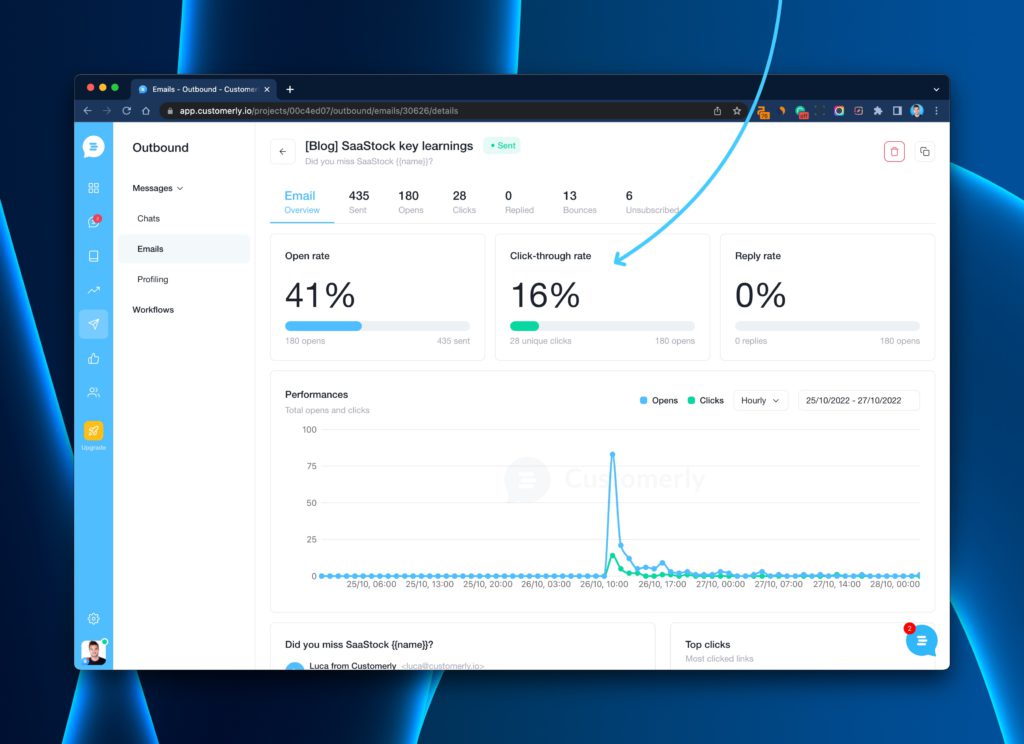
It is calculated by dividing the number of clicks on an ad or email by the number of times the ad or email was viewed, expressed as a percentage. For example, if an ad was clicked on 100 times and viewed 1,000 times, the CTR would be 10%.
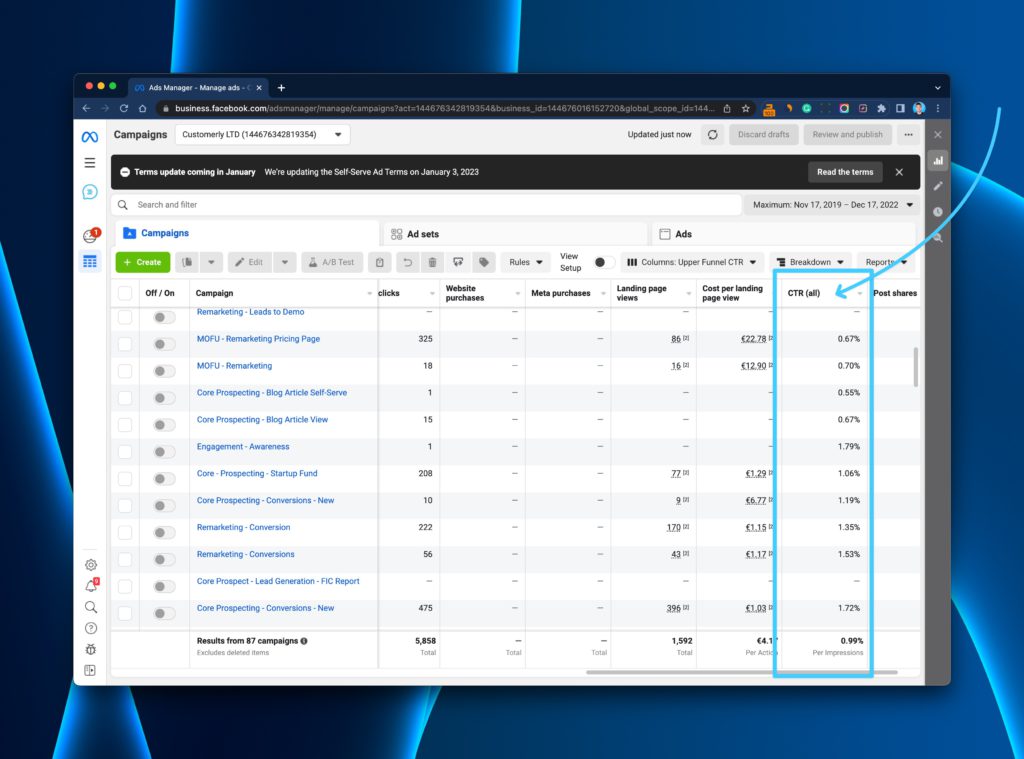
A high CTR indicates that the ad or email was effective at compelling people to click on it, while a low CTR may indicate that the ad or email was not relevant or interesting to the audience.
CPC – Cost Per Click
CPC is a term used in online advertising to refer to the amount an advertiser pays for each click on their ad.
Signup to Customer Rate
The signup-to-customer rate is a metric that reflects the percentage of people who sign up for a product or service and then ultimately become paying customers.
It is calculated by dividing the number of paying customers by the total number of people who signed up, and expressing the result as a percentage.
This metric is important for businesses because it helps them to understand the effectiveness of their marketing and sales efforts and to identify areas for improvement.
A high signup-to-customer rate indicates that a business is successfully converting potential customers into paying customers. In contrast, a low signup-to-customer rate may indicate that the business is losing potential customers at some point in the process.
Leads management systems
A leads management system is a software or platform that is used to track, organize, and manage leads in a business.
It is used to capture, store, and analyze potential customer information and help sales and marketing teams follow up on leads more efficiently.
Some features of a lead management system might include lead tracking, lead scoring, email marketing, and sales forecasting.
A leads management system aims to help businesses identify and prioritize the most promising leads and streamline the process of converting those leads into customers.
LTV/CLV – Customer Lifetime value
LTV stands for “lifetime value.” It measures the total revenue a customer is expected to generate for a business over their relationship with the company.
The customer lifetime value of a customer is calculated by multiplying the average purchase value by the number of purchases made per year and then multiplying that number by the average customer lifespan.
For example, if a customer has an average purchase value of $50, makes an average of 2 purchases per year, and has a customer lifespan of 5 years, their lifetime value would be $500 ($50 x 2 x 5).
The Customer Lifetime value is an important metric for businesses because it helps them understand the value of retaining customers and cultivating customer relationships.
By understanding the lifetime value of their customers, businesses can make informed decisions about how much to invest in customer acquisition and retention efforts.
TAM
TAM stands for “total addressable market.” It is a term used to refer to the total potential demand for a product or service in a given market.
TAM is typically calculated by estimating the number of potential customers in a market, their willingness to pay for a product or service, and the total revenue that could be generated from their purchases.
TAM is an important metric for businesses because it helps them understand the market’s size and potential and determine the feasibility of entering that market with their products or services.
By estimating TAM, businesses can also identify opportunities for growth and expansion and set realistic goals for their sales and revenue.
TAM can be calculated for a specific product or service or for an entire company or industry.
It is often used in conjunction with other metrics, such as market share and customer acquisition cost, to help businesses understand their competitive position in the market.
DAU/MAU/WAU
DAU/MAU/WAU are metrics used to measure the usage of a product or service. They are commonly used in the SaaS industry to track the popularity and engagement of online platforms.
DAU stands for “daily active users,” and it refers to the number of unique users interacting with a product or service on a given day.
MAU stands for “monthly active users,” which refers to the number of unique users interacting with a product or service in a given month.
WAU stands for “weekly active users,” which refers to the number of unique users interacting with a product or service in a given week.
These metrics are used to track the growth and engagement of a product or service over time, and they can provide valuable insights into how well a business is retaining and attracting users. They can also help businesses understand their users’ usage patterns and identify opportunities for improvement.
Financial SaaS Terms
Break-even
Breakeven refers to the point at which the total cost of a product or service is equal to its total revenue.
In other words, it is the point at which a business is able to cover all of its costs and start making a profit.
The breakeven point is typically calculated by taking the total fixed costs of a business (such as rent and salaries) and dividing it by the difference between the average selling price of the product or service and the variable cost per unit (such as materials and labor).
Once a business reaches its breakeven point, any additional sales will result in a profit.
Burn Rate
Burn rate refers to the rate at which a company is using up its available cash.
It is typically expressed in terms of how much a company spends per month.
A company with a high burn rate is using up its cash quickly, while a company with a low burn rate is using up its cash more slowly.
Burn rate is an important metric for startups and other businesses that rely on external funding, as it can help them plan and budget for future expenses and determine when they will need additional funding.
MoM Growth Rate
MoM growth rate is a metric that reflects the rate of change in a metric from one month to the next.
It is calculated by taking the current month’s metric value and dividing it by the value of the same metric from the previous month. The result is then expressed as a percentage.
MoM growth rate is often used to track the performance of a business or product over time and to identify trends or patterns in the data. It is typically used in conjunction with other metrics, such as year-over-year (YoY) growth rate, which compares the current month’s metric to the same month in the previous year, or quarter-over-quarter (QoQ) growth rate, which compares the current month’s metric to the previous quarter.
MoM growth rate can be a useful metric for businesses to track because it can provide a more up-to-date view of performance than other types of growth rate, which may be based on data from a longer time period. It can also help businesses to identify and respond to changes in the market or in their own performance more quickly.
CMGR
CMGR stands for “compound monthly growth rate.” It is a metric that reflects the rate of change in a metric over a period of time, typically expressed as a percentage.
To calculate CMGR, you take the metric’s value at the end of the period and divide it by the value of the same metric at the beginning of the period. The result is then expressed as a percentage and multiplied by the number of months in the period. For example, if a business’s revenue increased from $100,000 in January to $120,000 in June, the CMGR would be calculated as follows:
CMGR = ((120,000 / 100,000) – 1) * 6 = 20%
CMGR is often used to track the growth of a business or product over time and to identify trends or patterns in the data. It can be a useful metric for businesses to track because it provides a more detailed view of performance than other types of growth rate, which may be based on data from a longer time period. It can also help businesses to identify and respond to changes in the market or in their own performance more quickly.
Gross Profit
Gross profit is a financial metric that measures a business’s profitability before considering fixed costs, such as overhead and administrative expenses.
It is calculated by subtracting the cost of goods sold (COGS) from total revenue.
For example, if a business generates $100,000 in revenue and has COGS of $50,000, its gross profit would be $50,000 ($100,000 – $50,000).
Gross profit is an important metric for businesses because it helps them understand the profitability of their products or services.
It is often used to assess the efficiency of the business’s operations and identify improvement areas. Gross profit can also be used to compare the profitability of different products or services within a business.
COGS – Cost of Goods Sold
COGS stands for “cost of goods sold.” It refers to the direct costs of producing and selling a product or service.
COGS includes the cost of materials and labor directly used in the production of the product or service and any other direct costs associated with its production, such as manufacturing overhead.
COGS does not include indirect costs such as selling, general, and administrative expenses, which are considered overhead costs. These costs are not directly tied to the production of a specific product or service and are allocated to all products or services produced by a business.
COGS is an important metric for businesses because it helps them understand the cost of producing their products or services and the profitability of those products or services. It is often used to assess the efficiency of the business’s operations and identify improvement areas.
Concentration Risk
Concentration risk refers to the risk that a disproportionate concentration of assets, liabilities, or exposures in a specific area or sector may negatively impact a business’s financial performance or stability.
For example, a business that relies heavily on a single customer or supplier for a significant portion of its revenue may be at a concentration risk if it experiences financial difficulties or goes out of business. Similarly, a business with large exposure to a specific asset class, such as real estate, may be at risk of concentration risk if the value of that asset class declines significantly. In addressing these vulnerabilities, companies often employ strategies like list stacking to diversify and manage their dependencies more effectively.
Concentration risk can be mitigated through diversification, which involves spreading assets, liabilities, or exposures across a range of different areas or sectors. This can help reduce the impact of potential losses or declines in a specific area or sector on the business’s overall financial performance.
Customer Service SaaS Terms
SLA – Service Level Agreement
It is a contract between a service provider and a customer that outlines the level of service that the provider will deliver to the customer.
An SLA typically includes details such as the types of services that are covered, the availability of those services, and the response times that the service provider will commit to.
It may also specify other terms and conditions for cloud services providers, such as the terms of service, billing and payment terms, and any service level credits that may be offered to the customer if the service provider fails to meet the agreed-upon service levels.
SLAs are commonly used in IT services, outlining the level of support and maintenance that a service provider will offer to a customer. They are also used in other service-based industries, such as telecommunications and logistics.
SLAs are important because they help to ensure that service providers deliver a consistent level of service to their customers and that customers have clear expectations about the service they will receive.
A company can offer an SLA (Service Level Agreement) for its customer service effort such as replying to any inquiry in less than 24h.
Canned Response
A canned response is a pre-saved textual answer you can reuse to reply to frequent inquiries from your customers. It can be a short text or a long one indicating some steps.
You can find an extensive article about Canned Responses here, with the best one you can use for improving your customer support.
Customer Satisfaction SaaS Terms
CRR – Customer Retention Rate
Customer retention rate is a metric that reflects the percentage of customers that a business is able to retain over a given period of time. It is calculated by dividing the number of customers saas business has at the end of a period by the number of customers at the beginning of the period, and expressing the result as a percentage.
There are several ways to measure customer retention rate:
- Customer retention rate by cohort: This method involves dividing customers into groups based on when they first became customers (e.g., January, February, March, etc.). The retention rate for each cohort is then calculated separately.
- Customer retention rate by product or service: This method involves calculating the retention rate for each product or service offered by a business.
- Customer retention rate by customer segment: This method involves dividing customers into different segments (e.g., by age, location, etc.) and calculating the retention rate for each segment.
- Customer retention rate over time: This method involves tracking the retention rate of a business over a specific period of time (e.g., monthly, quarterly, annually) to see how it changes over time.
To calculate customer retention rate, a business needs to have accurate data on the number of customers at the beginning and end of the period being measured. This data can be collected through customer surveys, customer service inquiries, or through analysis of customer purchase data.
ACL – Average Customer Life
Average customer life, also known as customer lifetime value (CLV), is a metric that reflects the average amount of time that a customer is expected to remain with a business. It is calculated by dividing the total revenue generated by a customer over their lifetime by the number of years that they are expected to remain a customer.
CX – Customer Experience
Customer experience refers to a customer’s overall perception and feelings about a company and its products or services.
It includes all customer interactions with a business, from the initial purchase to post-purchase support and service.
Customer experience encompasses the entire customer journey and includes factors such as product quality, ease of use, personalized customer experience and service, and overall satisfaction with the company.
Businesses strive to create a positive customer experience because it can lead to increased customer loyalty and repeat business.
Companies that prioritize customer experience often train their employees to deliver excellent service, create user-friendly websites and products, and gather customer feedback to continuously improve the customer experience.
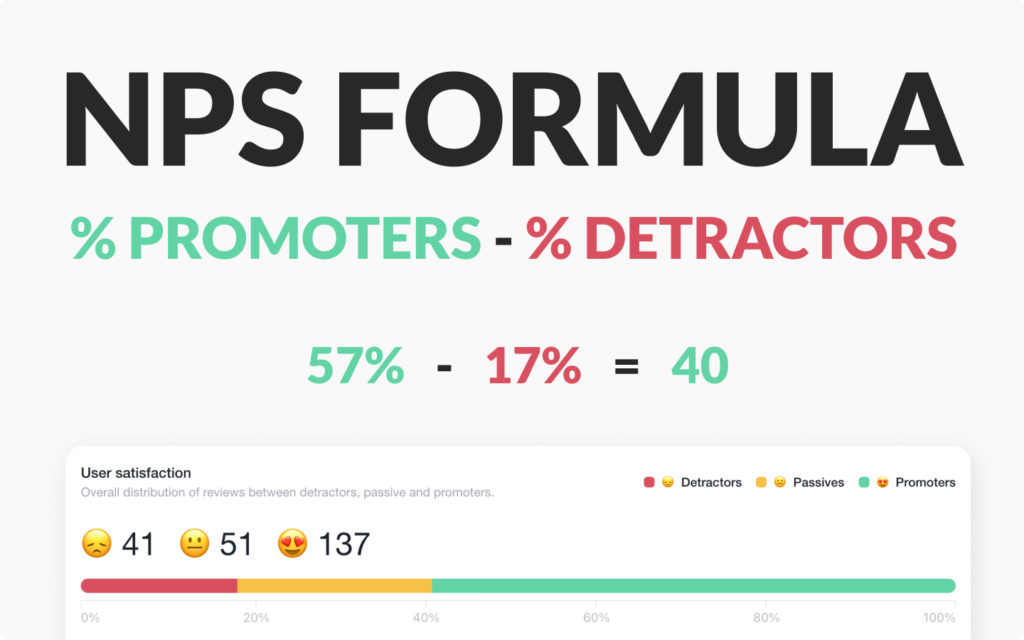
NPS – Net Promoter Score
Net promoter score (NPS) is one of the customer satisfaction metrics used to measure customers’ willingness to recommend a product to friends or colleagues.
Check out the extensive tutorial about how to calculate the Net Promoter Score.
CSAT – Customer Satisfaction Score
CSAT, or Customer Satisfaction (CSAT), is one of the customer satisfaction metrics that measure how satisfied a customer is with a product or service. It is typically calculated by asking customers to rate their satisfaction with a product or service on a scale, from 1 to 5, with 1 being very unsatisfied and 5 being very satisfied. Companies often use CSAT as a way to gauge the effectiveness of their products or services and to identify areas for improvement.
To calculate CSAT, companies typically ask customers to rate their satisfaction with a product or service after interacting. This can be done through surveys, phone calls, or other methods of gathering customer feedback.
The average rating is then calculated and used as a measure of overall customer satisfaction.
CSAT is an important metric for businesses because it helps them understand how their customers feel about their products and services.
By tracking CSAT over time, companies can identify trends and patterns in customer satisfaction and make adjustments as needed to improve the customer experience.
Product SaaS Terms
Customer Lifecycle or Journey
The customer lifecycle is the series of stages customers go through as they interact with a company and its products or services over time.
It begins when a customer becomes aware of a company and its offerings and ends when the customer either becomes a loyal repeat customer or decides to stop doing business with the company.
The customer lifecycle typically involves several stages, including:
- Awareness: The customer becomes aware of the company and its products or services.
- Consideration: The customer evaluates the company and its offerings and considers whether they are a good fit.
- Purchase: The customer makes a purchase or takes some other action (such as signing up for a trial or downloading a product).
- Post-purchase: The customer experiences the product or service and may provide feedback or interact with the company in other ways.
- Loyalty: The customer becomes a repeat customer or advocates for the company to others.
- Churn: The customer stops doing business with the company and becomes inactive.
Understanding the customer lifecycle is important for businesses because it helps them to identify and address any pain points or challenges that customers may encounter at each stage of the process.
Businesses can increase customer satisfaction, loyalty, and advocacy by optimizing the customer lifecycle.
Sales SaaS Terms
SDR – Sales Development Representative
SDR stands for “sales development representative.” It is a role that is responsible for identifying and qualifying potential sales leads, typically through outbound prospecting efforts such as cold email outreach and cold calling.
SDRs work closely with sales teams to help generate interest in a company’s products or services and to schedule appointments or demos for potential customers.
SDRs are often entry-level positions within a sales organization and are typically focused on the early stages of the sales process.
They may also be responsible for creating and maintaining a database of potential leads, tracking their progress through the sales funnel, and providing regular reports to sales and customer relationship management teams. SDR metrics typically include the number and quality of leads they generate and their ability to convert leads into paying customers.
MQL – Marketing Qualified lead
MQL stands for “marketing qualified lead.” It is a term used in marketing and sales to refer to a potential customer who has shown interest in a company’s products or services and who is likely to be a good fit for the business. MQLs are typically generated through marketing efforts such as email campaigns, social media advertising, or content marketing, and they have typically demonstrated their interest by taking some sort of action (such as downloading a whitepaper or signing up for a newsletter).
MQLs are usually considered to be further along in the sales process than leads that have not yet been qualified, but they are not yet ready to be handed off to the sales team for follow-up. Instead, MQLs are typically nurtured and qualified further by marketing teams through additional interactions and engagement with the company.
Once an MQL has been fully qualified and is ready to be converted into a paying customer, they are typically referred to as a sales qualified lead (SQL).
SQL – Sales Qualified Lead
A sales-qualified lead (SQL) is a potential customer who has shown strong interest in a company’s products or services and who is ready to be contacted by the sales team for follow-up.
SQLs are typically generated through marketing efforts such as email campaigns, social media advertising, or content marketing, and they have typically demonstrated their interest by taking some sort of action (such as downloading a whitepaper or signing up for a newsletter).
SQLs are typically further along in the sales process than leads that have not yet been qualified and are considered ready to be converted into paying customers.
As such, they are typically handed off to the sales team for follow-up and further qualification.
This might involve scheduling a sales call or demo, or providing additional information or resources to the potential customer. The sales team’s goal is to convert the SQL into a paying customer through the successful close of a sales opportunity.
PQL – Product Qualified Leads
Product qualified leads (PQLs) are potential customers who have demonstrated strong interest in a specific product or service offered by a company.
PQLs are typically generated through marketing efforts such as email campaigns, social media advertising, or content marketing, and they have typically demonstrated their interest by taking some sort of action (such as downloading a product brochure or signing up for a product demo).
PQLs are considered to be further along in the sales process than leads that have not yet been qualified, and they are typically ready to be handed off to the sales team for follow-up and further qualification.
This might involve scheduling a sales call or demo, or providing additional information professional services or resources to the potential customer.
The sales team’s goal is to convert the PQL into a paying customer through the successful close of a sales opportunity.
PQLs are often used by companies to focus their sales and marketing efforts on specific products or services that are likely to be of interest to potential customers.
By identifying and nurturing PQLs, companies can increase their chances of converting those leads into paying customers and maximize their return on investment in marketing and sales efforts.
TCV – Total Contract Value
It is a measure of the total value of a contract or agreement between a business and a customer.
TCV is a value based pricing typically calculated by multiplying the price of a product or service by the quantity being purchased. For example, if a business sells a product for $100 and a customer buys 10 units of the product, the TCV of the contract would be $1,000 ($100 x 10).
TCV is an important metric for businesses because it helps them understand the value of their contracts and the potential revenue they can generate from those contracts.
ACV – Annual Contract Value
It measures the total value of a contract or agreement between a business and a customer over the course of one year.
ACV is typically calculated by multiplying the total contract value (TCV) by the length of the contract in years. For example, if a business has a TCV of $1,000 and the contract is for two years, the ACV of the contract would be $2,000 ($1,000 x 2).
ACV is an important metric for businesses because it helps them understand the value of their contracts and the potential revenue that they can generate from those contracts over the long term.
Automate Smarter with
Customerly Aura
Related articles
Get the latest strategies, tips, and trends in customer service Learn how to deliver exceptional customer service and boost customer loyalty.